이 번 post 는 데이터 사이언스 스쿨에서 참조하여 작성합니다.1
NLTK 의 Text 클래스
Text 클래스 test 목적으로 다음의 code 를 수행 하였으나
import nltk
emma_raw = nltk.corpus.gutenberg.raw("austen-emma.txt")
from nltk.tokenize import RegexpTokenizer
retokenize = RegexpTokenizer("[\w]+")
from nltk import Text
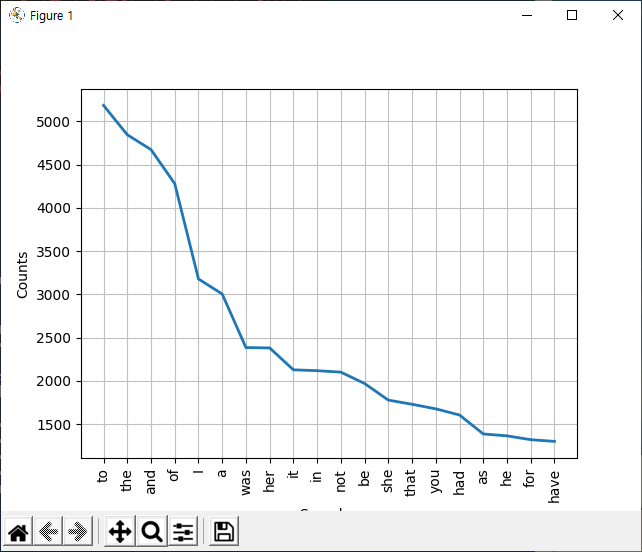
text = Text(retokenize.tokenize(emma_raw))
text.plot(20)다음과 같은 error 가 발생하였습니다.
Python 3.6.8 (tags/v3.6.8:3c6b436a57, Dec 24 2018, 00:16:47) [MSC v.1916 64 bit (AMD64)] on win32
Type "help", "copyright", "credits" or "license" for more information.
>>> import matplotlib
Traceback (most recent call last):
  File "<stdin>", line 1, in <module>
  File "C:\Users\jhlee\AppData\Roaming\Python\Python36\site-packages\matplotlib\__init__.py", line 174, in <module>
    _check_versions()
  File "C:\Users\jhlee\AppData\Roaming\Python\Python36\site-packages\matplotlib\__init__.py", line 159, in _check_versions
    from . import ft2font
ImportError: DLL load failed: 지정된 모듈을 찾을 수 없습니다.
사용중이던 환경은
- windows 10
- python 3.6.8
찾아본 여러가지 방법들이 있었으나 모두 실패 하고 Python 3.8.5 로 업그레이드 후에 그냥 동작했습니다.
It will look something like this:
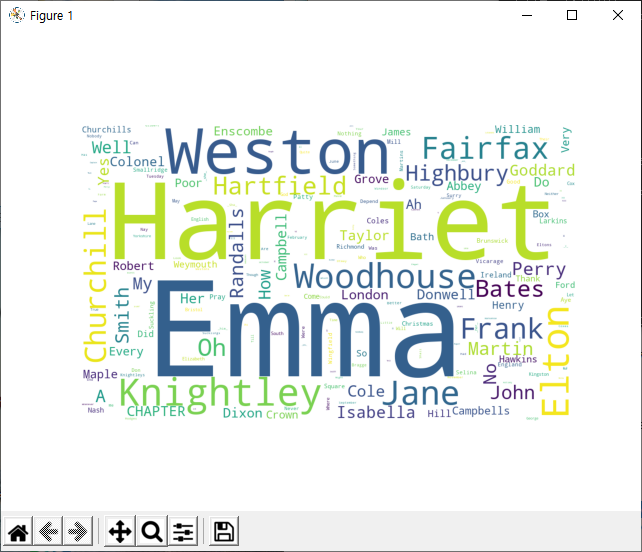
워드클라우드
wordcloud 라이브러리를 통해 사용 단어 빈도수에 따라 시각화가 가능합니다.
import nltk
emma_raw = nltk.corpus.gutenberg.raw("austen-emma.txt")
from nltk.tokenize import RegexpTokenizer
retokenize = RegexpTokenizer("[\w]+")
from nltk.tag import pos_tag
sentence = "Emma refused to permit us to obtain the refuse permit"

from nltk.tokenize import word_tokenize
tagged_list = pos_tag(word_tokenize(sentence))
tagged_list
from nltk import Text
text = Text(retokenize.tokenize(emma_raw))
from nltk import FreqDist
stopwords = ["Mr.", "Mrs.", "Miss", "Mr", "Mrs", "Dear"]
emma_tokens = pos_tag(retokenize.tokenize(emma_raw))
names_list = [t[0] for t in emma_tokens if t[1] == "NNP" and t[0] not in stopwords]
fd_names = FreqDist(names_list)

from wordcloud import WordCloud
wc = WordCloud(width=1000, height=600, background_color="white", random_state=0)
#plt.imshow(wc.generate_from_frequencies(fd_names))
#plt.axis("off")
#plt.show()
import matplotlib
matplotlib.pyplot.imshow(wc.generate_from_frequencies(fd_names))
matplotlib.pyplot.axis("off")
matplotlib.pyplot.show()